Read the map, not just the colors.
A practical reference for dates, units, coverage and the difference between a measurement and a model.
What kind of data am I seeing?
- Observation
- A measurement or recorded image for a stated time. It can have missing areas, processing delays and uncertainty. It is not automatically a complete or real-time view.
- Forecast
- A model’s prediction for a stated valid time, produced from a particular run. It can differ from what later happens. Compare predictions for the same time and variable.
- Historical background
- The Earth surface imagery beneath an overlay. It supplies context; it is not today’s cloud cover, a live camera or proof of conditions in a gap.
- Composite
- A product assembled from more than one image or time. Read its capture interval and processing notes instead of assuming every pixel was recorded at one instant.
- Reconstruction or schematic
- An educational model, such as ancient Earth or simplified atmospheric bands. Its frame, scale and assumptions matter. It is not a photograph or an exact measured boundary everywhere.
Four clocks can mean four different things
These are four possible kinds of source time, not four values that every layer always shows. The Maps sheet’s UTC time-of-day chip is not a dataset’s observation or forecast-valid timestamp. A layer left Off may describe its time fields without showing values. Turn on an available layer, then read its dated legend, details or selected value. If no source time is supplied, do not assume the data is current.
Open the weather & satellite map
Open Maps, then Earth Layers. On a narrow screen that inner tab may read Layers, and a category dropdown replaces desktop pills. Layers on · N shows how many layers are active; an Off control applies only after a layer is on.
Find these controls on your screen
Open Maps first. Inside that sheet, open Earth Layers (shortened to Layers on a narrow screen), then choose a category. Scroll inside the controls sheet if its lower controls are out of view. A category choice opens its layer cards; it does not itself turn a layer on.
Dated interface examples captured 11 November 2026. The UTC chip shown in a screenshot is an example time of day, not a dataset timestamp or current conditions. The narrow example is a 390-pixel browser view, not a physical-phone test. No observation or forecast overlay is enabled in these examples.
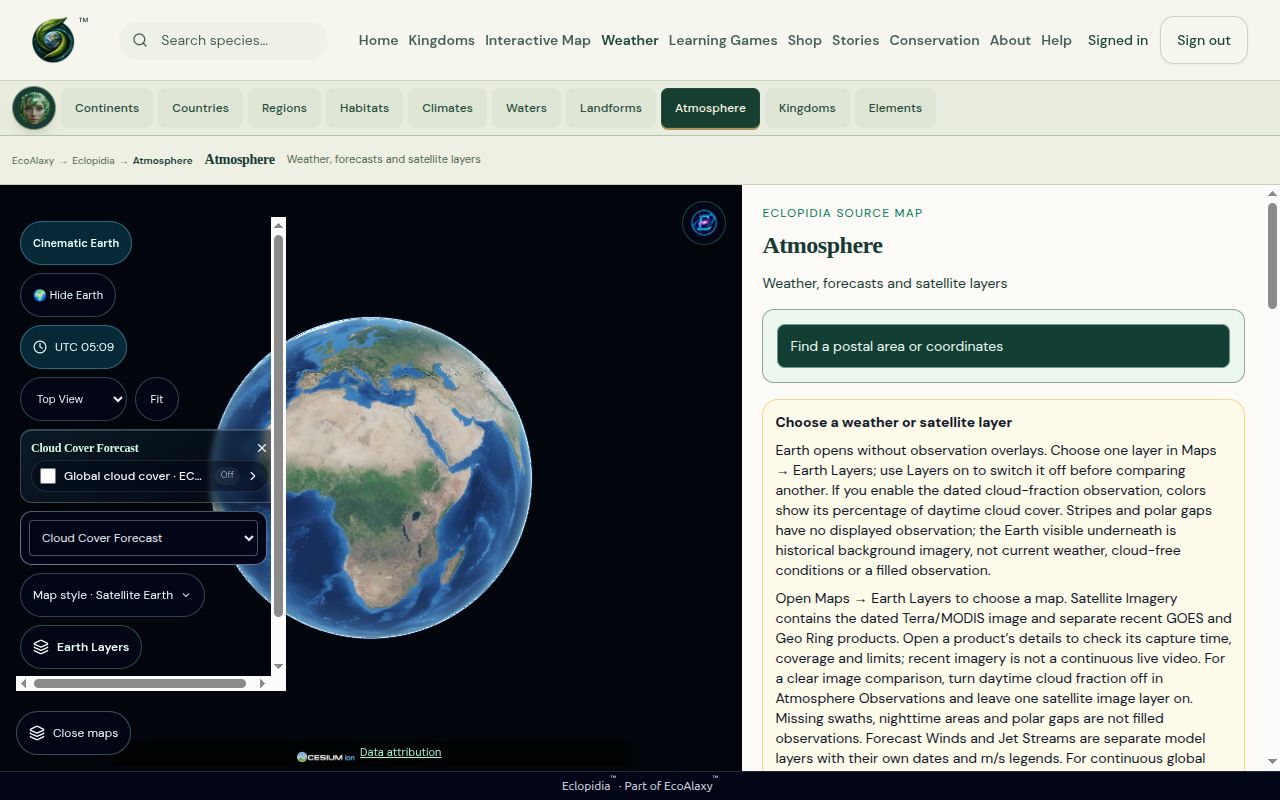
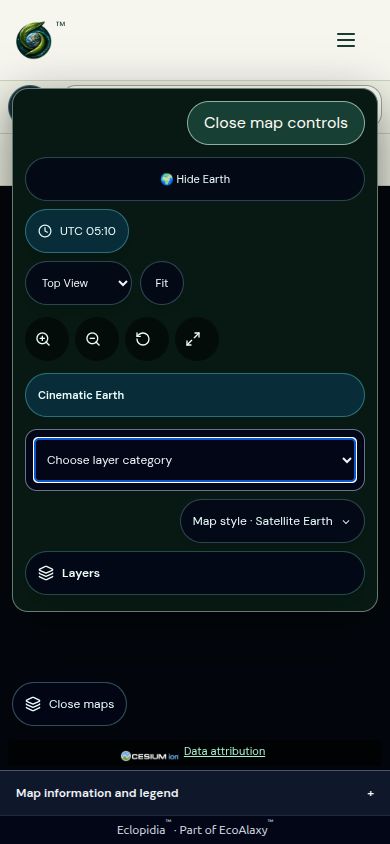
To compare layers: turn one on, read its dated details, and use its Off control or Layers on before showing another. A screenshot cannot establish that a feed is currently available. Source credits remain on the map; see data types and coverage limits below.
- Run / initialization time
- The reference time for a model run. A product may be released hours after that time; the run timestamp is not its download time.
- Valid time
- When the forecast applies. A future valid time means a prediction, even if you downloaded the file a moment ago.
- Capture / observation time
- When the source recorded the image or measurement. A composite may use an interval rather than one timestamp.
- Checked / retrieved time
- When a service checked for, or obtained, the data. It does not make an older capture or model run new.
Example only: a forecast initialized at 06:00 UTC and valid at 12:00 UTC predicts conditions six hours after initialization. If your page checked it at 09:00 UTC, that check does not change either source time.
UTC is a shared time reference. A timestamp ending in Z uses UTC. Your local clock can show another date or hour; compare the timestamp and its timezone before concluding that a layer is late. Daylight-saving changes affect local offsets, not the meaning of the source’s UTC label.
When an expiry or unavailable message appears, the page may hide the old frame. A successful reload does not establish that a new frame exists. Check the source dates and visible message. ECMWF explains initialization times and delayed availability; USNO explains UTC and Universal Time.
Read the quantity and unit together
| Label | How to read it |
|---|---|
| °C | Temperature in degrees Celsius. Check whether the value is near the surface, at another height, or a model reference. |
| m/s | Speed in metres per second. Multiply by 3.6 for kilometres per hour. Wind at one model level is not necessarily surface wind. |
| kt / knots | Speed in nautical miles per hour. One knot equals 1.852 km/h. Do not read a knot value as the same number of m/s. |
| hPa | Pressure in hectopascals. A pressure-level layer is not a fixed geometric height everywhere. |
| % | A percentage of the quantity named by the source. Cloud fraction, probability and other percentages are different measurements. |
| µg/m³ | A concentration in micrograms per cubic metre. A PM2.5 concentration is not itself an Air Quality Index number; check which quantity the layer displays. |
| mm | A depth, often used for precipitation. Read its accumulation interval; an hourly amount and a daily total are not interchangeable. |
| m / km | Metres / kilometres. Check whether the layer means elevation, depth, altitude or distance, and what reference it uses. |
| Ma | Millions of years ago in an ancient-Earth reconstruction. It is a modeled age, not a capture date. |
Always read the legend’s variable, color scale and time interval. The same red color can mean different things in different layers. A lightning-density display is not automatically a count of every ground strike, and a probability color does not guarantee an event.
What a gap does—and does not—tell you
A satellite product can have missing swaths, areas not yet observed, polar limits, nighttime limits or other unavailable pixels. Transparent pixels can reveal historical Earth underneath. They do not establish clear skies, zero pollution, no lightning or an absence of clouds.
A cloud forecast is a separate modeled product. Turning it on does not turn a missing satellite observation into a measured one. Compare one layer at a time if their colors are hard to distinguish.
Zooming enlarges the available display; it does not add source detail. Some coarse layers intentionally hide at close range, and regional charts appear only within their source coverage and supported scale. Neither proves that the page covers every location.
If a layer looks displaced, clipped or corrupted across views, report the layer, page, selected view and browser. Some gaps are source gaps; some problems are rendering failures. Do not assume every black stripe has the same cause. NASA’s Worldview guide explains common imagery gaps.
Useful map words
- Layer / overlay
- A dataset displayed over the base Earth. Layers can cover or obscure one another. Use Layers on to turn one off before a comparison.
- Legend
- The key connecting symbols or colors to a variable and its values. Read it before judging the picture.
- Opacity
- How see-through the display is. Changing opacity changes the picture, not the source value or its timestamp.
- Resolution / grid
- The source’s level of spatial detail or sampling layout. A selected cell may represent an area, not a measurement exactly at your pointer.
- Coverage
- Where and when a source supplies usable data. A map can show Earth globally while a particular layer covers only a region.
- Latitude / longitude
- Angular coordinates locating a point on Earth. Read the control’s required order and sign convention. Postal-area estimates are not verified street addresses.
- Range / occurrence
- A species range summarizes distribution; an occurrence is a recorded presence. Neither a broad region label nor a schematic point is a live animal position. Missing records do not prove absence.
- Source / attribution
- Who produced the data or media, with links and reuse credit. A link is not a guarantee of complete coverage, uninterrupted availability or identical definitions between providers.
- Fit / Reset view
- Camera controls. Fit brings the whole Earth into view. These controls do not update a dataset or repair an unavailable provider.
Included maps and unavailable sources
Earth background and close-up detail
The default Earth background currently uses historical NASA Blue Marble imagery, including polar coverage. It is a coarse background, not today’s weather or a live camera. Finer imagery is paused while its licensing is verified. Zooming in enlarges the available background; it cannot reveal detail that this source does not contain.
You can still choose the separately dated satellite, observation and forecast layers in Maps → Earth Layers. Read that layer’s source, date and coverage; switching layers does not make the historical background current. The pause notice stays visible so you can distinguish this background limit from a failed weather layer.
The current release includes dated satellite imagery, point forecasts and postal/coordinate lookup; modeled cloud cover, winds and jet streams; lightning density, auroras, air quality and air-mass imagery; ocean-current forecasts and regional station observations; aviation/ash advisories, educational charts/routes, nautical sources and compatible ancient-Earth reconstructions. Each layer keeps its own dates, units, region and source limits. Included does not mean every source is available at every moment.
Analyzed weather fronts: NOAA regional layer
Open Atmosphere → Maps → Earth Layers → Analyzed Weather Fronts. Turn on “Analyzed fronts · NOAA · North America,” then use View regional coverage. Select a colored line for its class, analysis time and source. Layers on → Off removes it. Cold, warm, stationary and occluded fronts are separate classes; “surface boundary” can also mean a trough, outflow boundary, squall line or dry line. No movement direction is inferred.
This regional surface analysis is decoded from the official high-resolution CODSUS/ASUS02 public text product. Positions are reported to 0.1 degree; the display connects them geodesically and raises the lines 2.5 km for visibility, not a measured front altitude. Pressure centers are omitted and exact duplicate lines are collapsed. Analyses are normally produced every three hours; our shared cache checks every 30 minutes. The valid time comes from the bulletin’s VALID field, not its download time or the API’s header timestamp. Eclopidia removes lines six hours after that valid time; this is our freshness limit, not an official NWS expiration. Failed refreshes retain only a still-fresh verified frame.
NWS CODSUS specification, section 9 · Official product index · NWS reuse conditions. NWS source data are public domain; Eclopidia’s decoded display is not an official NWS product or endorsement. Regional coverage is not worldwide completeness. The analysis shows positions at its valid time. Use the separate Regional Forecast Fronts group for future positions.
Regional forecast fronts: NOAA coded forecasts
Choose Maps → Earth Layers → Regional Forecast Fronts. NOAA’s CODSRP bulletin supplies forecast positions at 12, 24, 36 and 48-hour product horizons. These labels are not hours after you open the page or after publication; use the displayed issued and valid UTC times. Each line joins vertices rounded to whole degrees. The display omits pressure centres, duplicates and segments that round to one point. Lines are raised only to keep them visible over Earth. This is regional forecast guidance, separate from analyzed positions and unsuitable for navigation or warnings.
We hide a bulletin at its valid time or 18 hours after issue, whichever comes first. This is our display limit. The globe provides NOAA regional forecasts through the 48-hour product. Day 3 and global front layers are unavailable. The older Day 2/3 GIS feed is excluded because its file timestamps conflict with the forecast dates printed on its features.
NOAA forecast bulletin index · NWS specification, section 12. Derived educational display; no NOAA endorsement.
For the provider’s longer-range charts, see NWS National Forecast Maps and look under Medium Range Forecasts. These charts open on the provider’s site.
Official charts for other regions
Outside the NOAA layer’s area? These links open separate publisher charts. They are not Eclopidia globe overlays, and neither chart covers the whole world. Use your browser’s Back button to return.
Asia & western North Pacific · JMA surface analysis, 06 UTC edition
The Japan Meteorological Agency labels this chart ASAS-06. Read the full analysis date printed on the image; “06 UTC” alone does not identify its day. For other editions, use the ASAS row in JMA’s official chart index. The publisher’s page is in Japanese; chart times and many labels use UTC and English.
North Atlantic & Europe · DWD surface analysis (large image)
This Deutscher Wetterdienst chart shows regional analyzed fronts and surface pressure. Check its printed UTC date and time. The image can take longer to open on a slow connection. DWD’s original analysis-file index is also available.
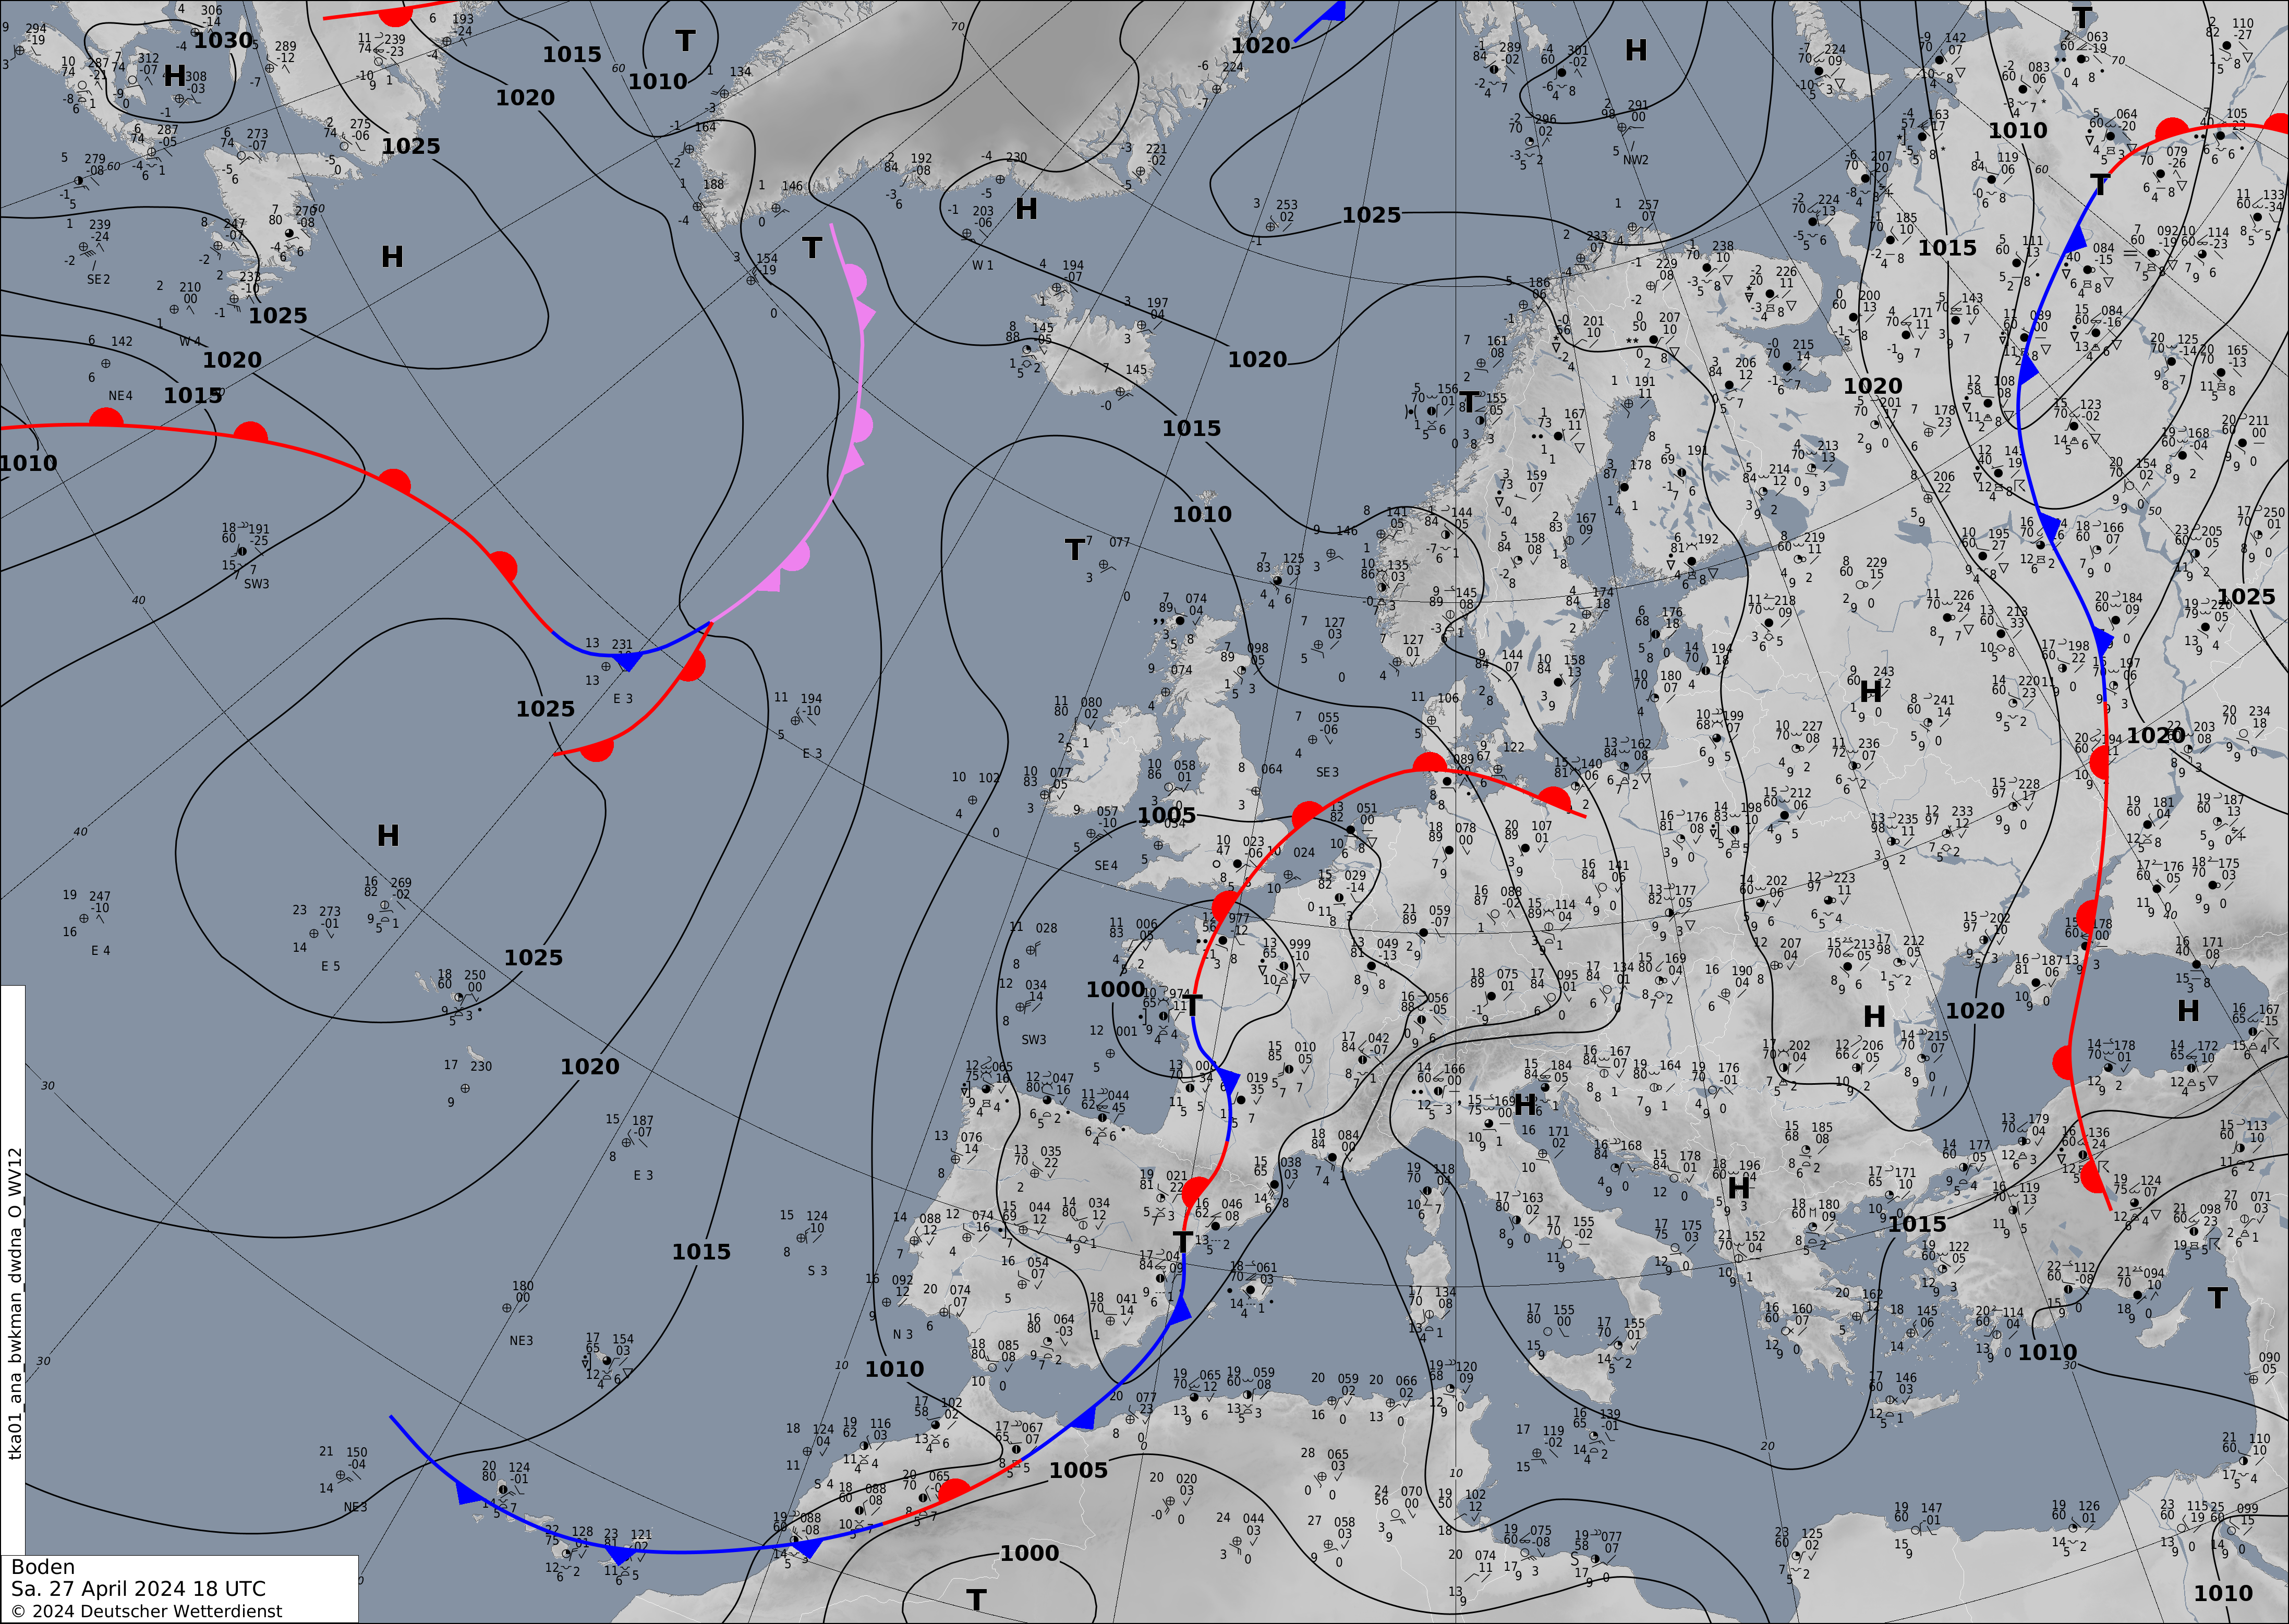
The publishers can replace these charts at the same addresses. A source analysis describes its stated time; it is not a prediction for your visit. Read each chart’s own symbols and limits. Eclopidia has not traced these images into geographic lines or combined them into a worldwide analysis.
Compare an ancient-Earth reconstruction
Open Continents → Continental Drift and choose 100 Ma under Reconstruction frame. Once the frame loads, open PALEOMAP terrain reference · independent comparison. The globe shows the CAO2024 plate reconstruction. The separate image shows Scotese and Wright’s modeled elevation and depth for PALEOMAP Map 23, whose recorded source age is 102.6 Ma. The image uses Eclopidia’s color scale for the source grid. Its colors represent elevation and depth estimates. Vegetation is unavailable.
Use the comparison to see how two sources describe ancient Earth. The source ages differ, and alignment between the models is unverified. Eclopidia displays the reference separately in the details panel. The detail panel links to the source and CC BY 4.0 license. Choose another frame to continue exploring the plate model.
Other limits that do not disable the published alternatives
- NOAA GFS forecasts for winds at 10 m, 850 hPa and 250 hPa use the NOAA Open Data archive. The earlier NOMADS endpoint remains on hold. IFS is a separate forecast model. Wind glyphs and coloured speed bands are derived displays, limited to 80°S–80°N, with dates and speeds in m/s. They do not show real-time measurements or flight conditions.
- Ancient reconstruction geometry and classified tectonic features are included. Terrain and vegetation layers aligned with the plate model remain unavailable.
- FAA charts and routes remain educational and unsuitable for operational navigation. The retained edition discrepancy is not a claim of current operational chart coverage.
Regional fronts and the NOAA Open Data wind source were checked on 10 November 2026; the other source limits were reviewed on 8 November. Check each layer’s own clock and source details before use.
A quick comparison checklist
- Choose one layer and read its name, source and type.
- Check capture time, model run and valid time—whichever apply.
- Read the variable, unit, level and accumulation interval.
- Check regional coverage, resolution, gaps and expiry messages.
- Turn it off through Layers on, then inspect the next layer in the same place and for a comparable time.
For the controls themselves, return to Move the globe or Find weather for a location. Eclopidia is an educational explorer; use the relevant official service for operational navigation, warnings and safety decisions.
Updated 11 November 2026.